OrthoFinder Tutorials Phylogenetic orthology inference for comparative genomics
3. Exploring OrthoFinder's results
In the last tutorial (Running an example OrthoFinder analysis) we downloaded proteomes for 6 model species, pre-processed these files and ran OrthoFinder on them. If you haven’t done these steps yourself you can download the results from here: Results_model_species.tar.gz.
Plan for this tutorial
In this tutorial we’re going to explore the results of the OrthoFinder’s comparative genomics analysis. The analysis OrthoFinder performs is pretty extensive so we’ll start with the key OrthoFinder results files and explore them as you would explore your own results. You can also see a complete listing of the OrthoFinder results files on the GitHub page: https://github.com/davidemms/OrthoFinder#what-orthofinder-provides.
A first look at the results
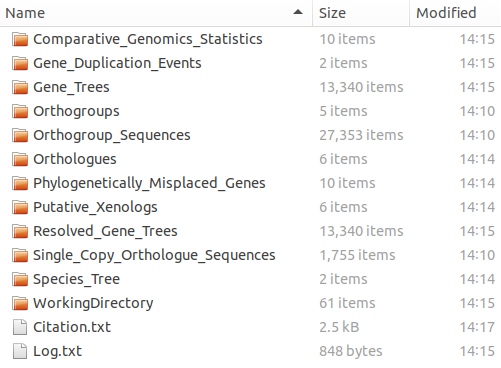
By default OrthoFinder creates a results directory called ‘OrthoFinder’ inside the input proteome directory and puts the results here. My results directory looks like this:
Quality Control: Percentage of genes in orthogroups
The first thing I like to check is how many genes were assigned to orthogroups. In the output from OrthoFinder it printed this text:
OrthoFinder assigned 121743 genes (92.9% of total) to 17981 orthogroups.
(This info is also in Comparative_Genomics_Statistics/Statistics_Overall.tsv.)
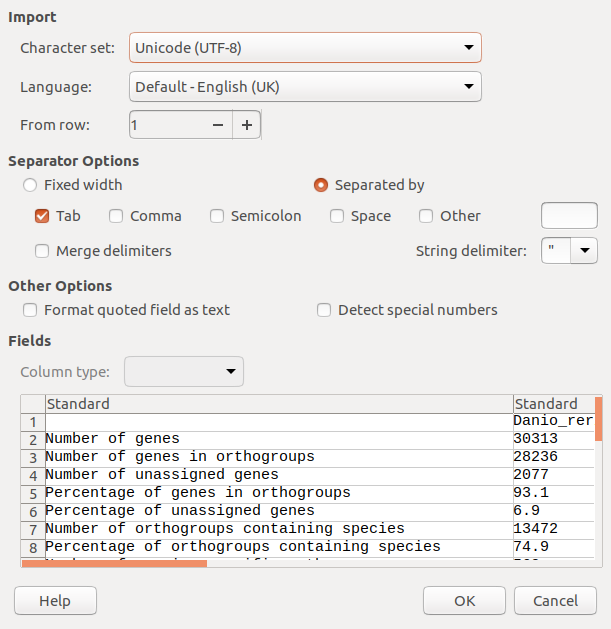
That’s pretty good, in general it’s nice to see at least 80% of your genes assigned to orthogroups. Fewer than this means that you are probably missing orthology relationships that actually exist for some of the remaining genes, poor species sampling is the most likely cause for this. Let’s also check the percentages on a per species basis. There’s a tab-delimited file called Comparative_Genomics_Statistics/Statistics_PerSpecies.tsv. Like other “.tsv” files from OrthoFinder this is best viewed in a spreadsheet program like Excel or LibreOffice Calc. These files might be handled correctly on your computer automatically or you might need to tell it explicitly that they are tab-delimited. Here is how you would do that with LibreOffice or Excel.
LibreOffice:
Excel: (You may have to select ‘All Files’ at the bottom right hand corner of the open file dialog first in order to see .tsv files.)
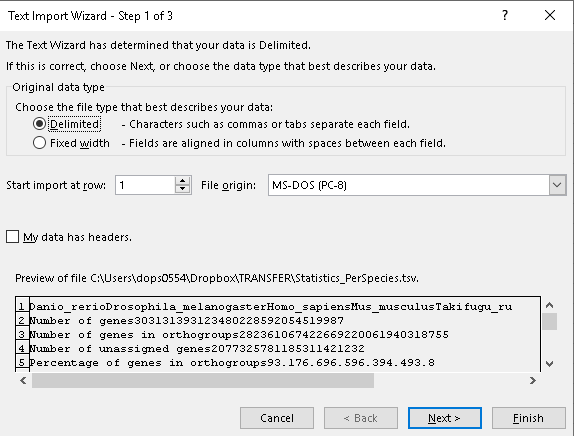
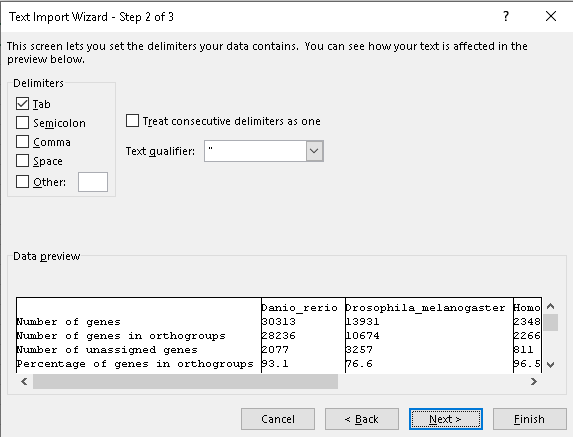
Once you’ve opened this file you’ll see that the vertebrates all have over 90% of their genes assigned to orthogroups whereas Drosophila has about 76% of its genes assigned. This is probably due to species sampling. The four vertebrate species are all relatively closely related whereas the species sampling around both Drosophila and C. elegans was poor. To improve this we would need to include some species that break up the long branches in the species tree separating these species from all the others.
Species Tree
Let’s look at the species tree next. Dendroscope is a tree viewer you can download and run locally and is the best option if you’re going to look at more than a few trees. Alternatively, there are also a number of options you can run from you’re web browser, e.g. the ETE Toolkit tree viewer. Using one of these, open the file Species_Tree/SpeciesTree_rooted.txt. As this file has bootstrap values Dendroscope will need you to select the option “Interpret as edge labels” to view them correctly. The species tree looks like this:
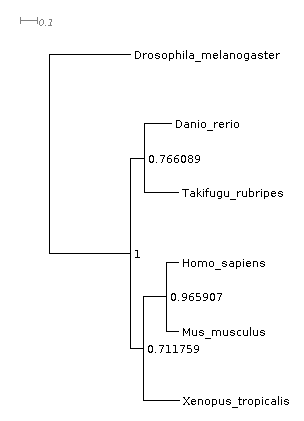
This tree has been inferred by OrthoFinder using the STAG algorithm and rooted using the STRIDE algoirithm so it’s ready to interpret (ordinarily you would have to root a tree yourself first). You can see here that Drosophila is on longer branches than the other species, as mentioned above. If you know what the species tree should look like, you should check that the tree matches what you expect. The tree OrthoFinder inferred here is correct.
If the species tree is not correct then this will not impact the orthogroup inference, but it might affect the orthologue inference in some of the gene trees which have gene duplication events. In this case, you’ll probably want to run the very last bit of the OrthoFinder analysis again with the corrected species tree (-ft and -s options). This is generally pretty quick, as all the computationally expensive calculation (inference of orthogroups and gene trees etc.) has already been done. See OrthoFinder best practices.
Aside: You’ll notice in this tree that the support values are not all 100%, which you might have expected them to be for this dataset. With the default options, species tree inference is performed with STAG, which uses the proportion of species trees derived from single-locus gene trees supporting each bipartition as its measure of support. This is a more stringent measure than standard bootstrap support from a multiple sequence alignment. If instead the “-M msa” option had been used then a concatenated multiple sequence alignment would have been used for the species tree inference instead and support values of 100% would have been seen for all bipartition. In this case the support values correspond to bootstrap replicates taken from the full, multi-gene alignment, which is a different thing entirely. This is the most common measure for support and will always report higher support values for the same data.
Orthologues
One of the most common reasons for running OrthoFinder is to find the orthologue of a gene you’re interested in. Let’s look at the orthologues of the Drosophila gene FBgn0005648, which is involved in the cleavage and polyadenylation steps of the nuclear cleavage/polyadenylation reaction (see FlyBase). This is an interesting gene since there have been two gene duplication events in the lineage leading to humans, as we’ll see. Let’s find out what it’s orthologues are in human.
In the Orthologues directory there is a sub-directory for each species. Open Orthologues/Orthologues_Drosophila_melanogaster/Drosophila_melanogaster__v__Homo_sapiens.tsv in a spreadsheet program (specifying that it’s tab-delimited if necessary). The file has three columns, “Orthogroup”, “Drosophila_melanogaster” and “Homo_sapiens”. Find “FBgn0005648” in the table, you’ll see that the gene is in orthogroup OG0001189 and that it has three orthologues in human: ENSG00000205022, ENSG00000100836, ENSG00000258643.
Gene Trees
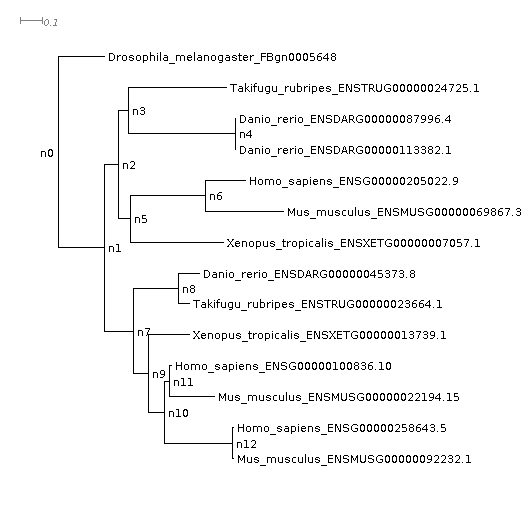
We’ve found that FBgn0005648 has three orthologues in human. Next we’re going to look at the gene tree to see if we agree with this and to see how these three orthologues arose. Open Gene_Trees/OG0001189_tree.txt with Dendroscope or a web-based viewer.
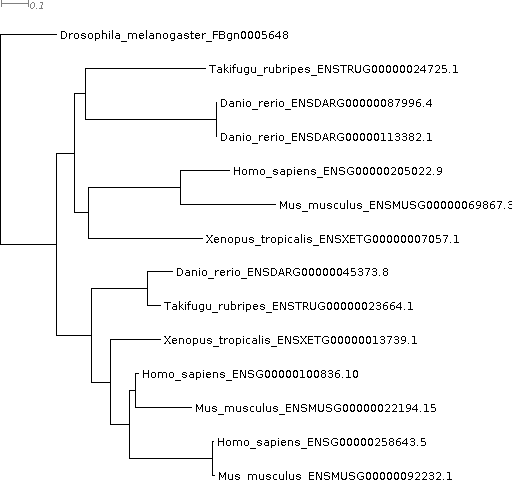
If you are used to inferring and looking at gene trees the first thing you’ll notice is that OrthoFinder has automatically rooted the tree for you—the tree is rooted on the Drosophila gene FBgn0005648. This makes it really convenient for quickly checking gene trees and is especially useful for more complex, harder to interpret gene trees.
Aside: The default gene trees don’t have support values. OrthoFinder has, after all, assigned ~121,000 genes into orthogroups and inferred almost 18,000 gene trees for these genes in about 15 minutes! We’ll discuss how to get support values in a later tutorial.
Looking at the gene tree we can see that two gene duplication events occurred, one shared by the vertebrates and a second shared by human and mouse. This has resulted in a one-to-three orthology relationship, i.e. all three of the human genes are equally closely related to the one Drosophila gene. It’s often the case that orthology relationships aren’t one-to-one, and it’s important to know this—you don’t want to spend months doing experiments on ‘the orthologue’ only to find out later there are actually three!
We can look at the page for this gene on FlyBase: http://flybase.org/reports/FBgn0005648.html. If you go down to the “Orthologs” section, and then look at “Human Orthologs” you’ll see that the only methods that identified all three of these orthologues were the tree-based methods Compara, eggNOG, OrthoFinder and TreeFam. OrthoFinder is the only one that you can run on your own data. The score-based methods such as Hieranoid, Inparanoid, OMA and OrthoMCL identified only one, or none, of these orthologues. Gene trees are particularly important for identifying and resolving these complex relationships.
Gene Duplication Events
Having the gene trees means that OrthoFinder can identify all gene duplication events that occurred. Let’s look at those that happened in the common ancestor of the vertebrates. OrthoFinder labels the nodes of the species tree in the file Species_Tree/SpeciesTree_rooted_node_labels.txt, open this with Dendropscope and tell it to “Interpret as node labels”. We’ll look at the node ‘N1’, the common ancestor of vertebrates (i.e. D. rerio, T. rubripes, X. tropicalis, H. sapiens and M. musculus). There are two files that give details about the gene duplications events. Let’s first open Gene_Duplication_Events/SpeciesTree_Gene_Duplications_0.5_Support.txt in Dendroscope.
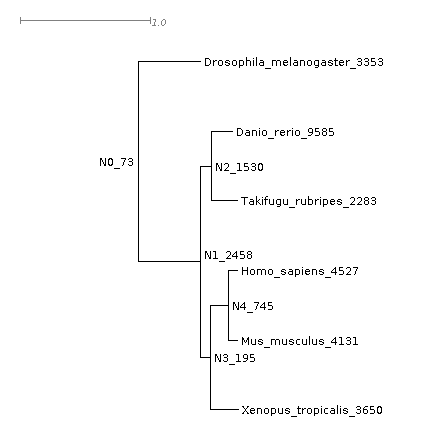
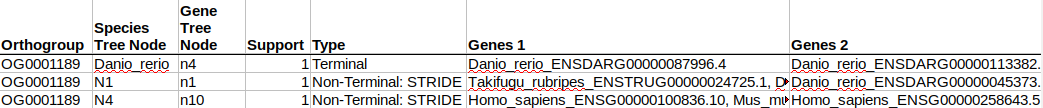
This gives a summary of gene duplication events. Each node shows the node name followed by an underscore and then the number of well-supported gene duplication events mapped to each node in the species tree. Gene-duplication events are considered ‘well-supported’ if at least 50% of the descendant species have retained both copies of the duplicated gene. For the common ancestor of the tetrapods, N1, there were 2458 of these well-supported gene duplication events. We can see the list of these gene duplication events in the file Gene_Duplication_Events/Duplications.tsv. Here are just a few lines from the file, sorted by the species tree node on which they occurred:
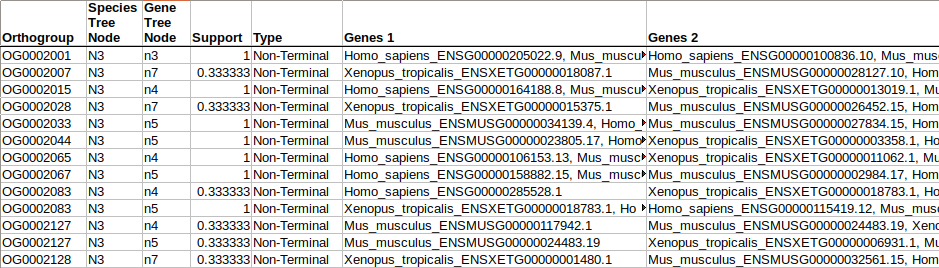
Each gene duplication event is cross-referenced to the species tree node, the orthogroup/gene tree in which it occurred and the node in that gene tree. It also lists the genes descended from each of the two copies arising from the gene duplication event. We can check this out for our FBgn0005648 orthologues. For this we need to look at the gene tree in the Resolved_Gene_Trees/OG0001189_tree.txt. This directory contains the gene trees with the nodes labelled. These files show how OrthoFinder interpreted the gene trees when inferring orthologues and gene duplication events. They can differ slightly from the original gene trees that came directly from the tree inference step (available in Gene_Trees/). To get the Resolved Gene Trees OrthoFinder carries out a Duplication-Loss-Coalescence analysis to identify the more parsimonious interpretation of the tree.
Reading from the table, there was a gene duplication event at node n1 with both copies 100% retained in all the descendant species. Looking at the tree, the second gene duplication event was on node n10, and if we go back to the table we can see that this one is listed as well as the terminal gene duplication event in Danio rerio:
If you’re interested in gene duplication events then this table contains a lot of data. Across these six species OrthoFinder identified 34,065 gene duplication events, all of which are cross-referenced to the node of the species tree and gene tree on which they occurred! These events are also summarised by orthogroup and by species tree node in the files Duplications_per_Orthogroup.tsv and Duplications_per_Species_Tree_Node.tsv which are both in the directory Comparative_Genomics_Statistics/.
Orthogroups
Often we’re interested in group-wise species comparisons, that is comparisons across a clade of species rather than between a pair of species. The generalisation of orthology to multiple species is the orthogroup. Just like orthologues are the genes descended from a single gene in the last common ancestor of a pair of species an orthogroup is the set of genes descended from a single gene in a group of species. Each gene tree from OrthoFinder, for example the one above, is for one orthogroup. The orthogroup gene tree is the tree we need to look at if we want it to include all pairwise orthologues. And even though some of the genes within an orthogroup can be paralogs of one another, if we tried to take any genes out then we would also be removing orthologs too.
So if we want to do a comparison of the ‘equivalent’ genes in a set of species, we need to do the comparison across the genes in an othogroup. The orthogroups are in the file Orthogroups/Orthogroups.tsv. This table has one orthogroup per line and one spcies per column and is ordered from largest orthogroup to smallest. There is also a file in the legacy OrthoMCL format: Orthogroups/Orthogroups.txt.
Orthogroup Sequences
For each orthogroup there is a FASTA file in Orthogroup_Sequences/ which contains the sequences for the genes in that orthogroup.
Other Results Files
We’ll look at some more of the results files in the next tutorial. You can also see a complete listing on the GitHub page here: https://github.com/davidemms/OrthoFinder#what-orthofinder-provides.
The GitHub page also contains a discussion of orthologues, paralogues and orthogroups.
Written on September 20th, 2019 by David Emms